Visualizing Performance
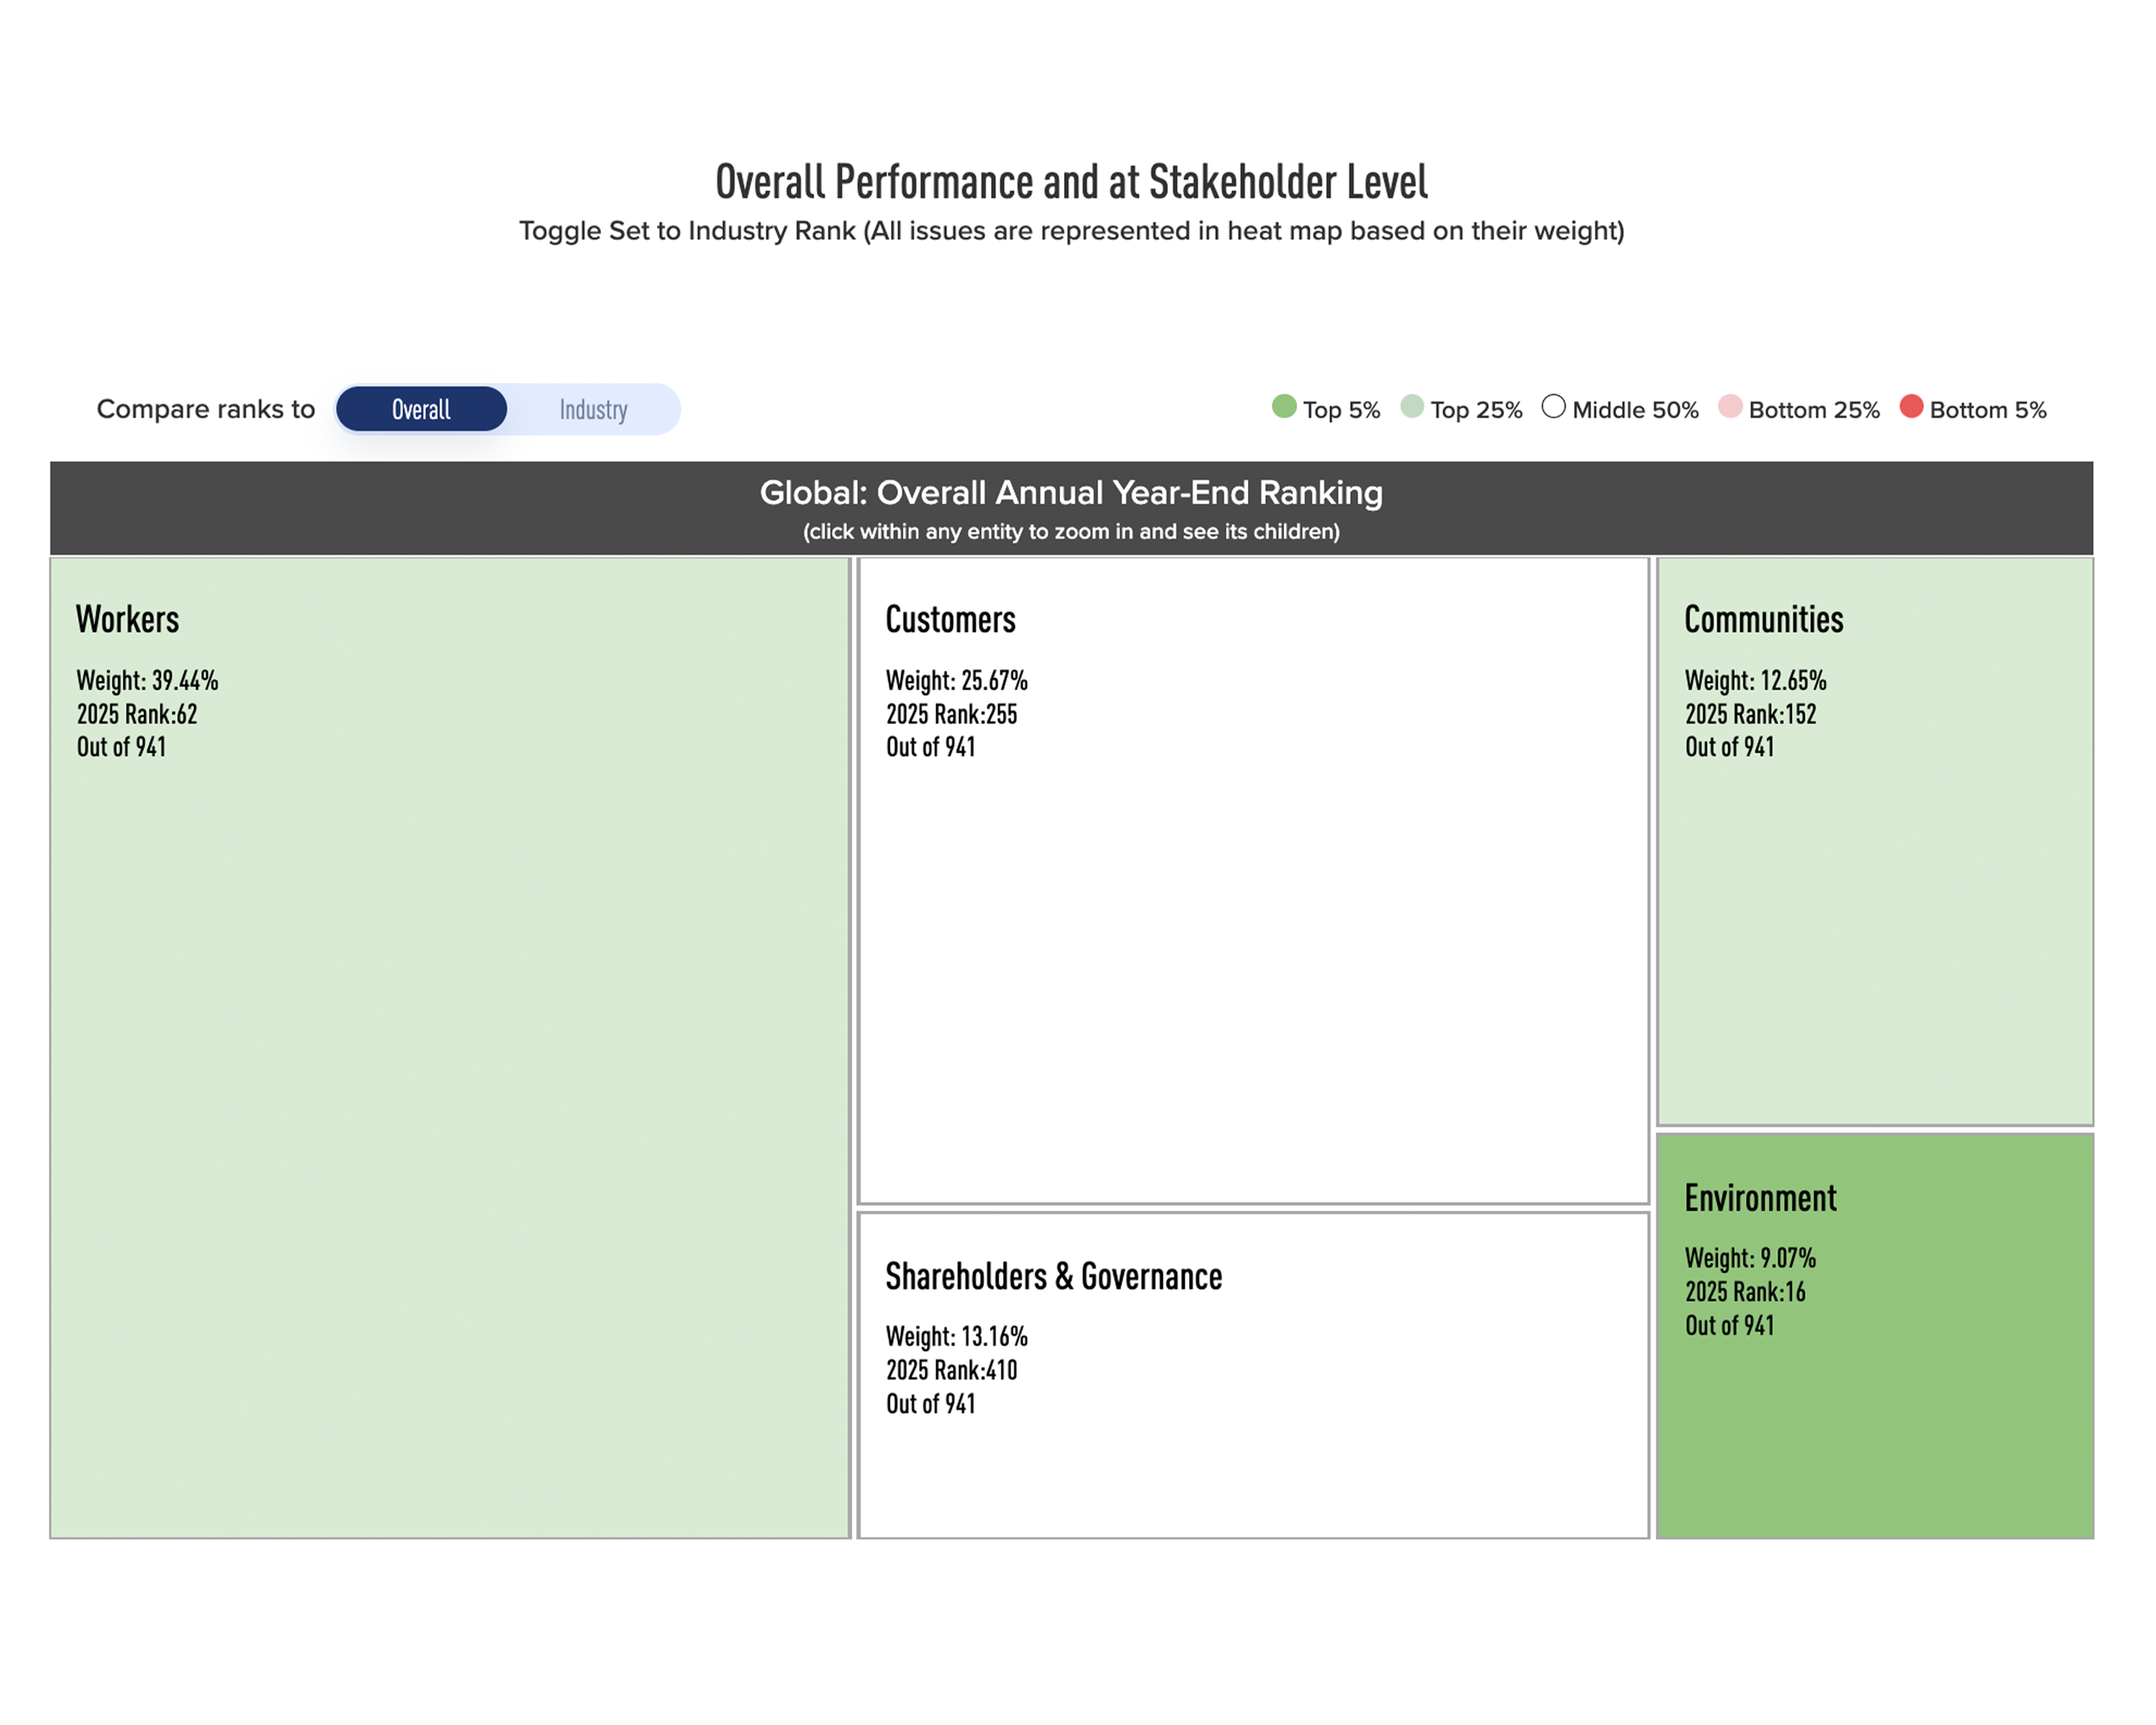
See this ranking year’s performance through an interactive chart that let’s you drill down into the JUST Capital taxonomy and visualize where you are performing well and where your company has opportunities to improve.

Year-Over-Year Insights
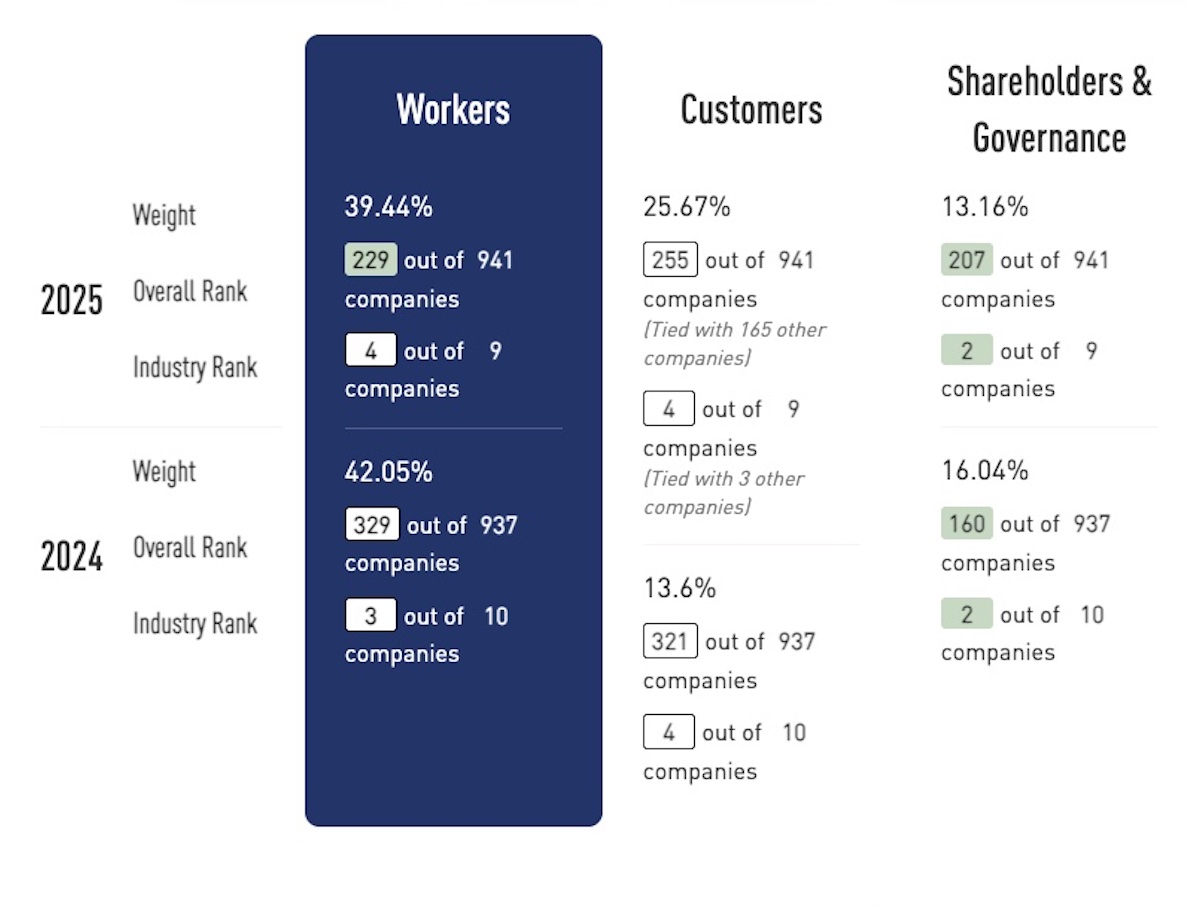
Easily understand your company’s year-over-year performance to see trends, spot improvements, and identify areas needing attention.

Data Point Specifics
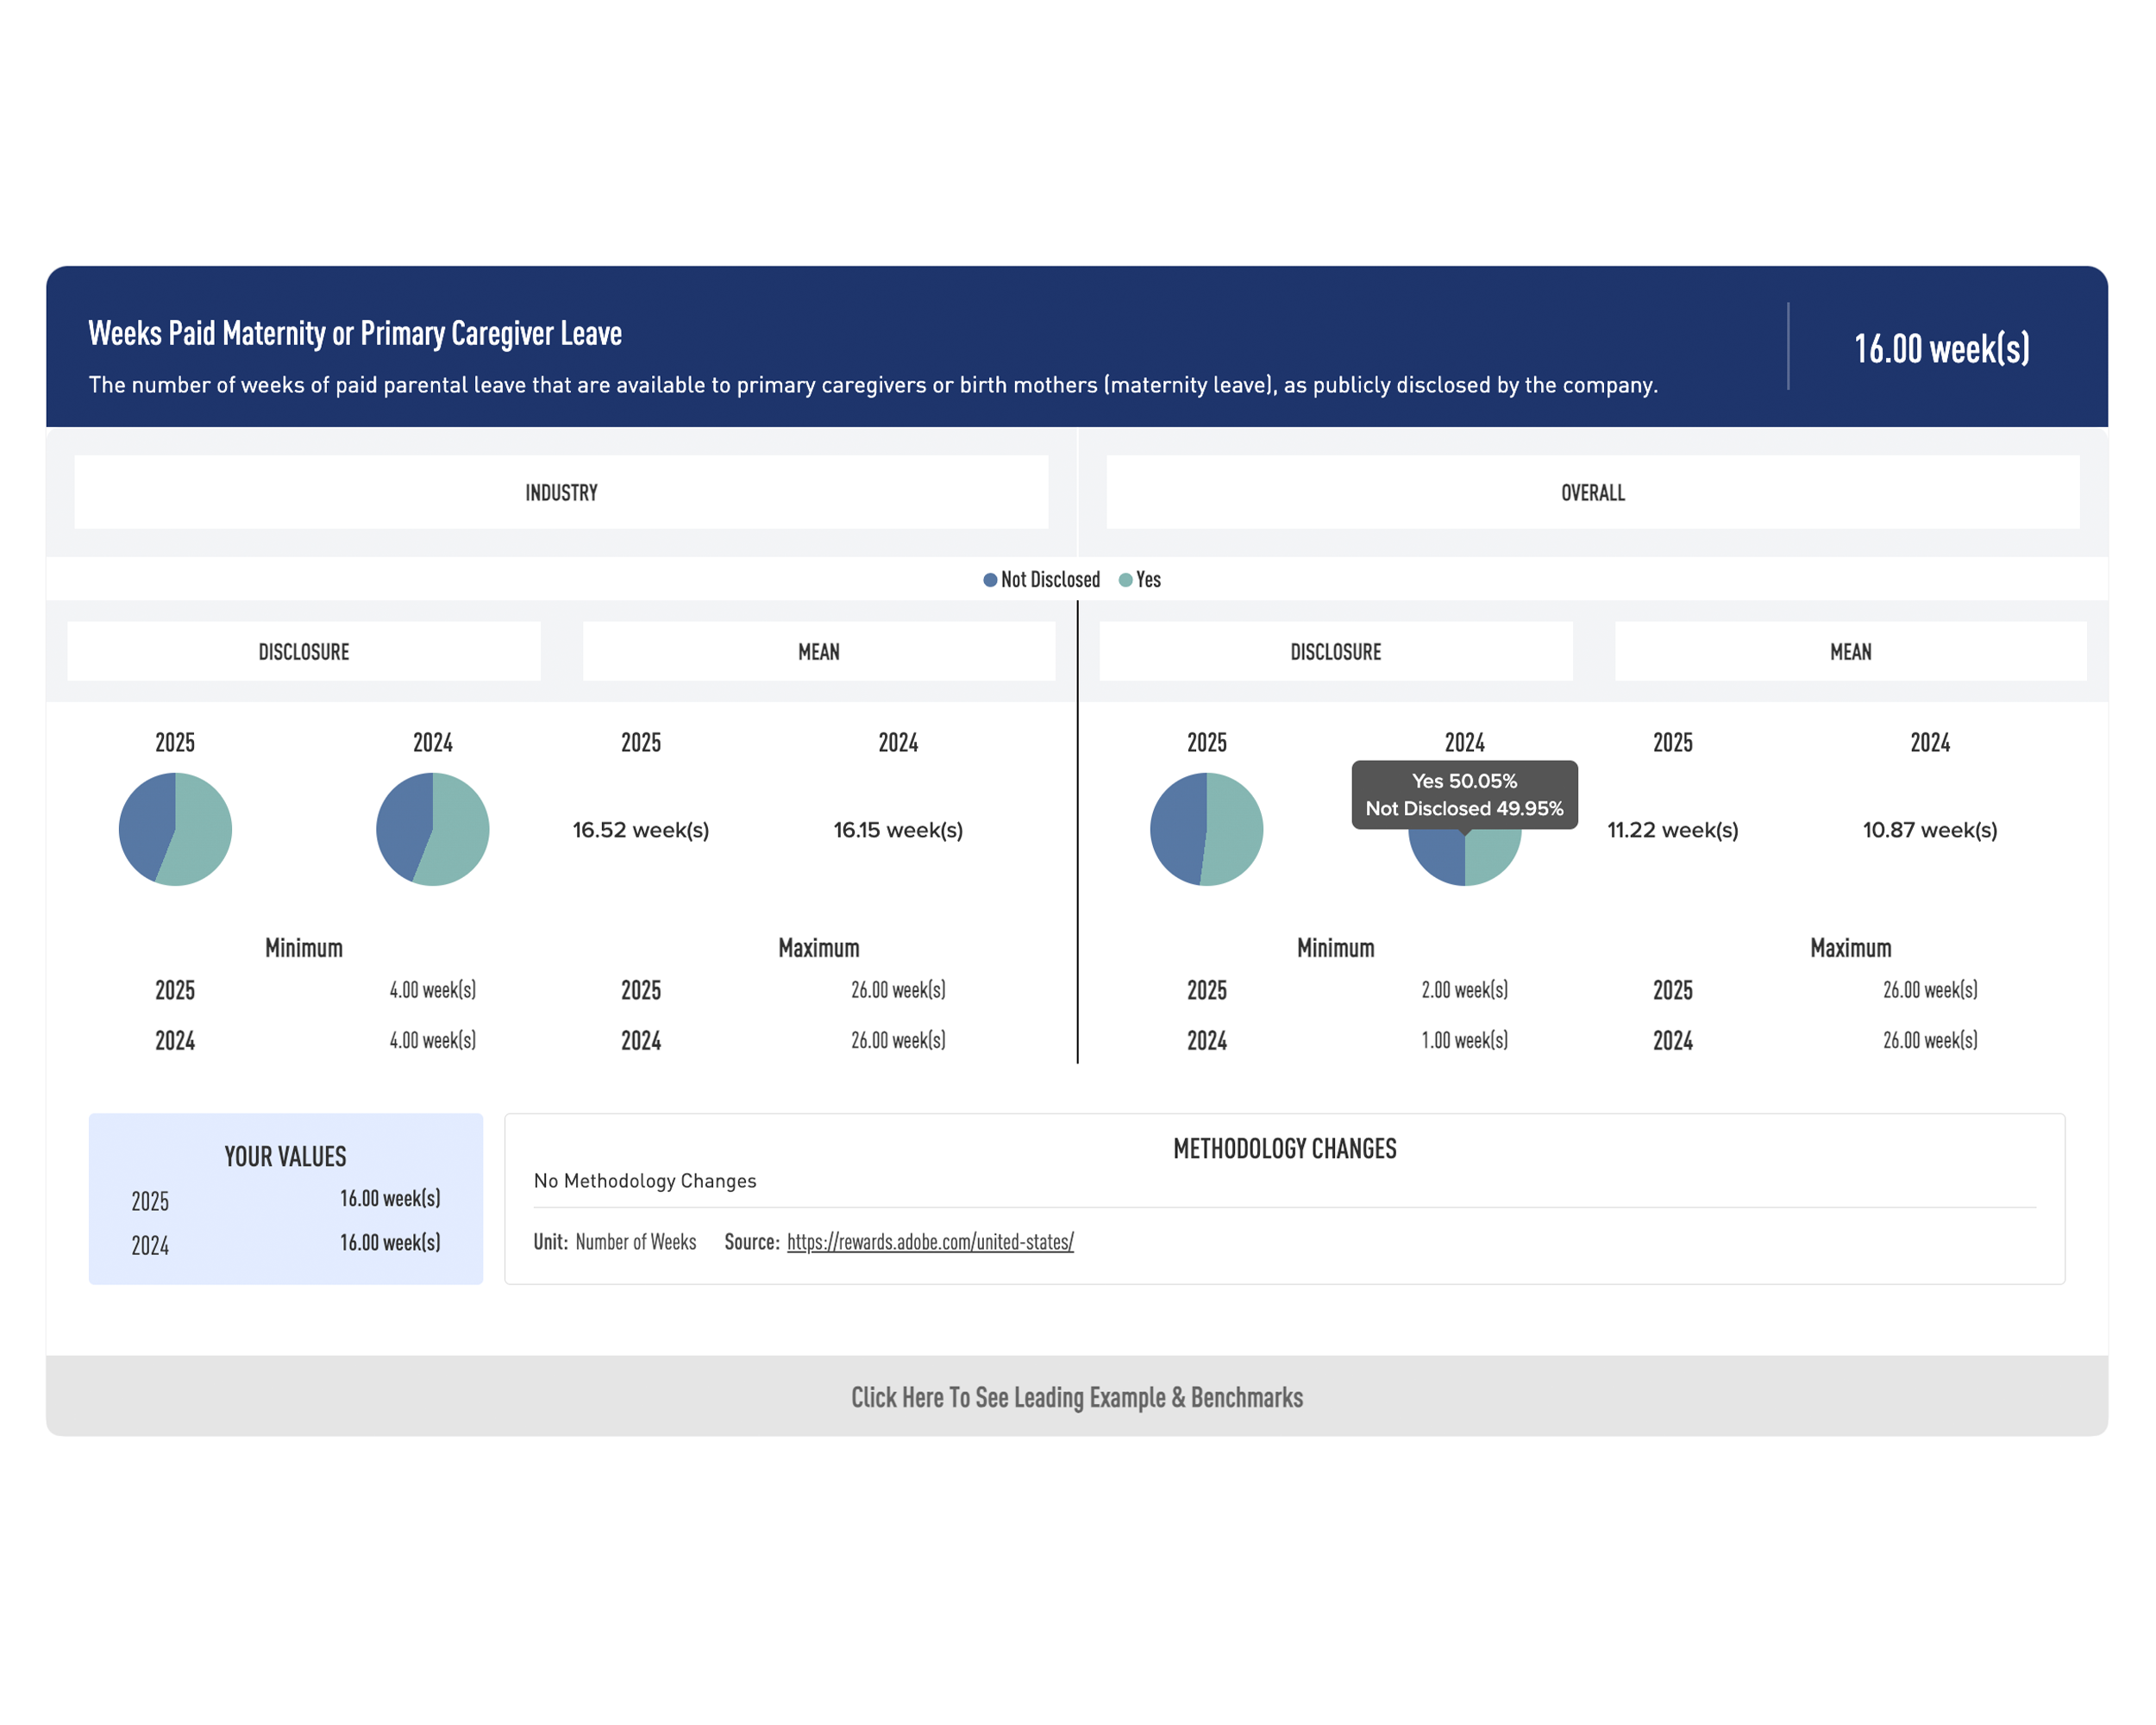
View the data point description, methodology changes (where applicable), your company’s value, and year-over-year benchmarking information for subscribers across all JUST Capital collected data points.

Want to Know How Others Are Disclosing?
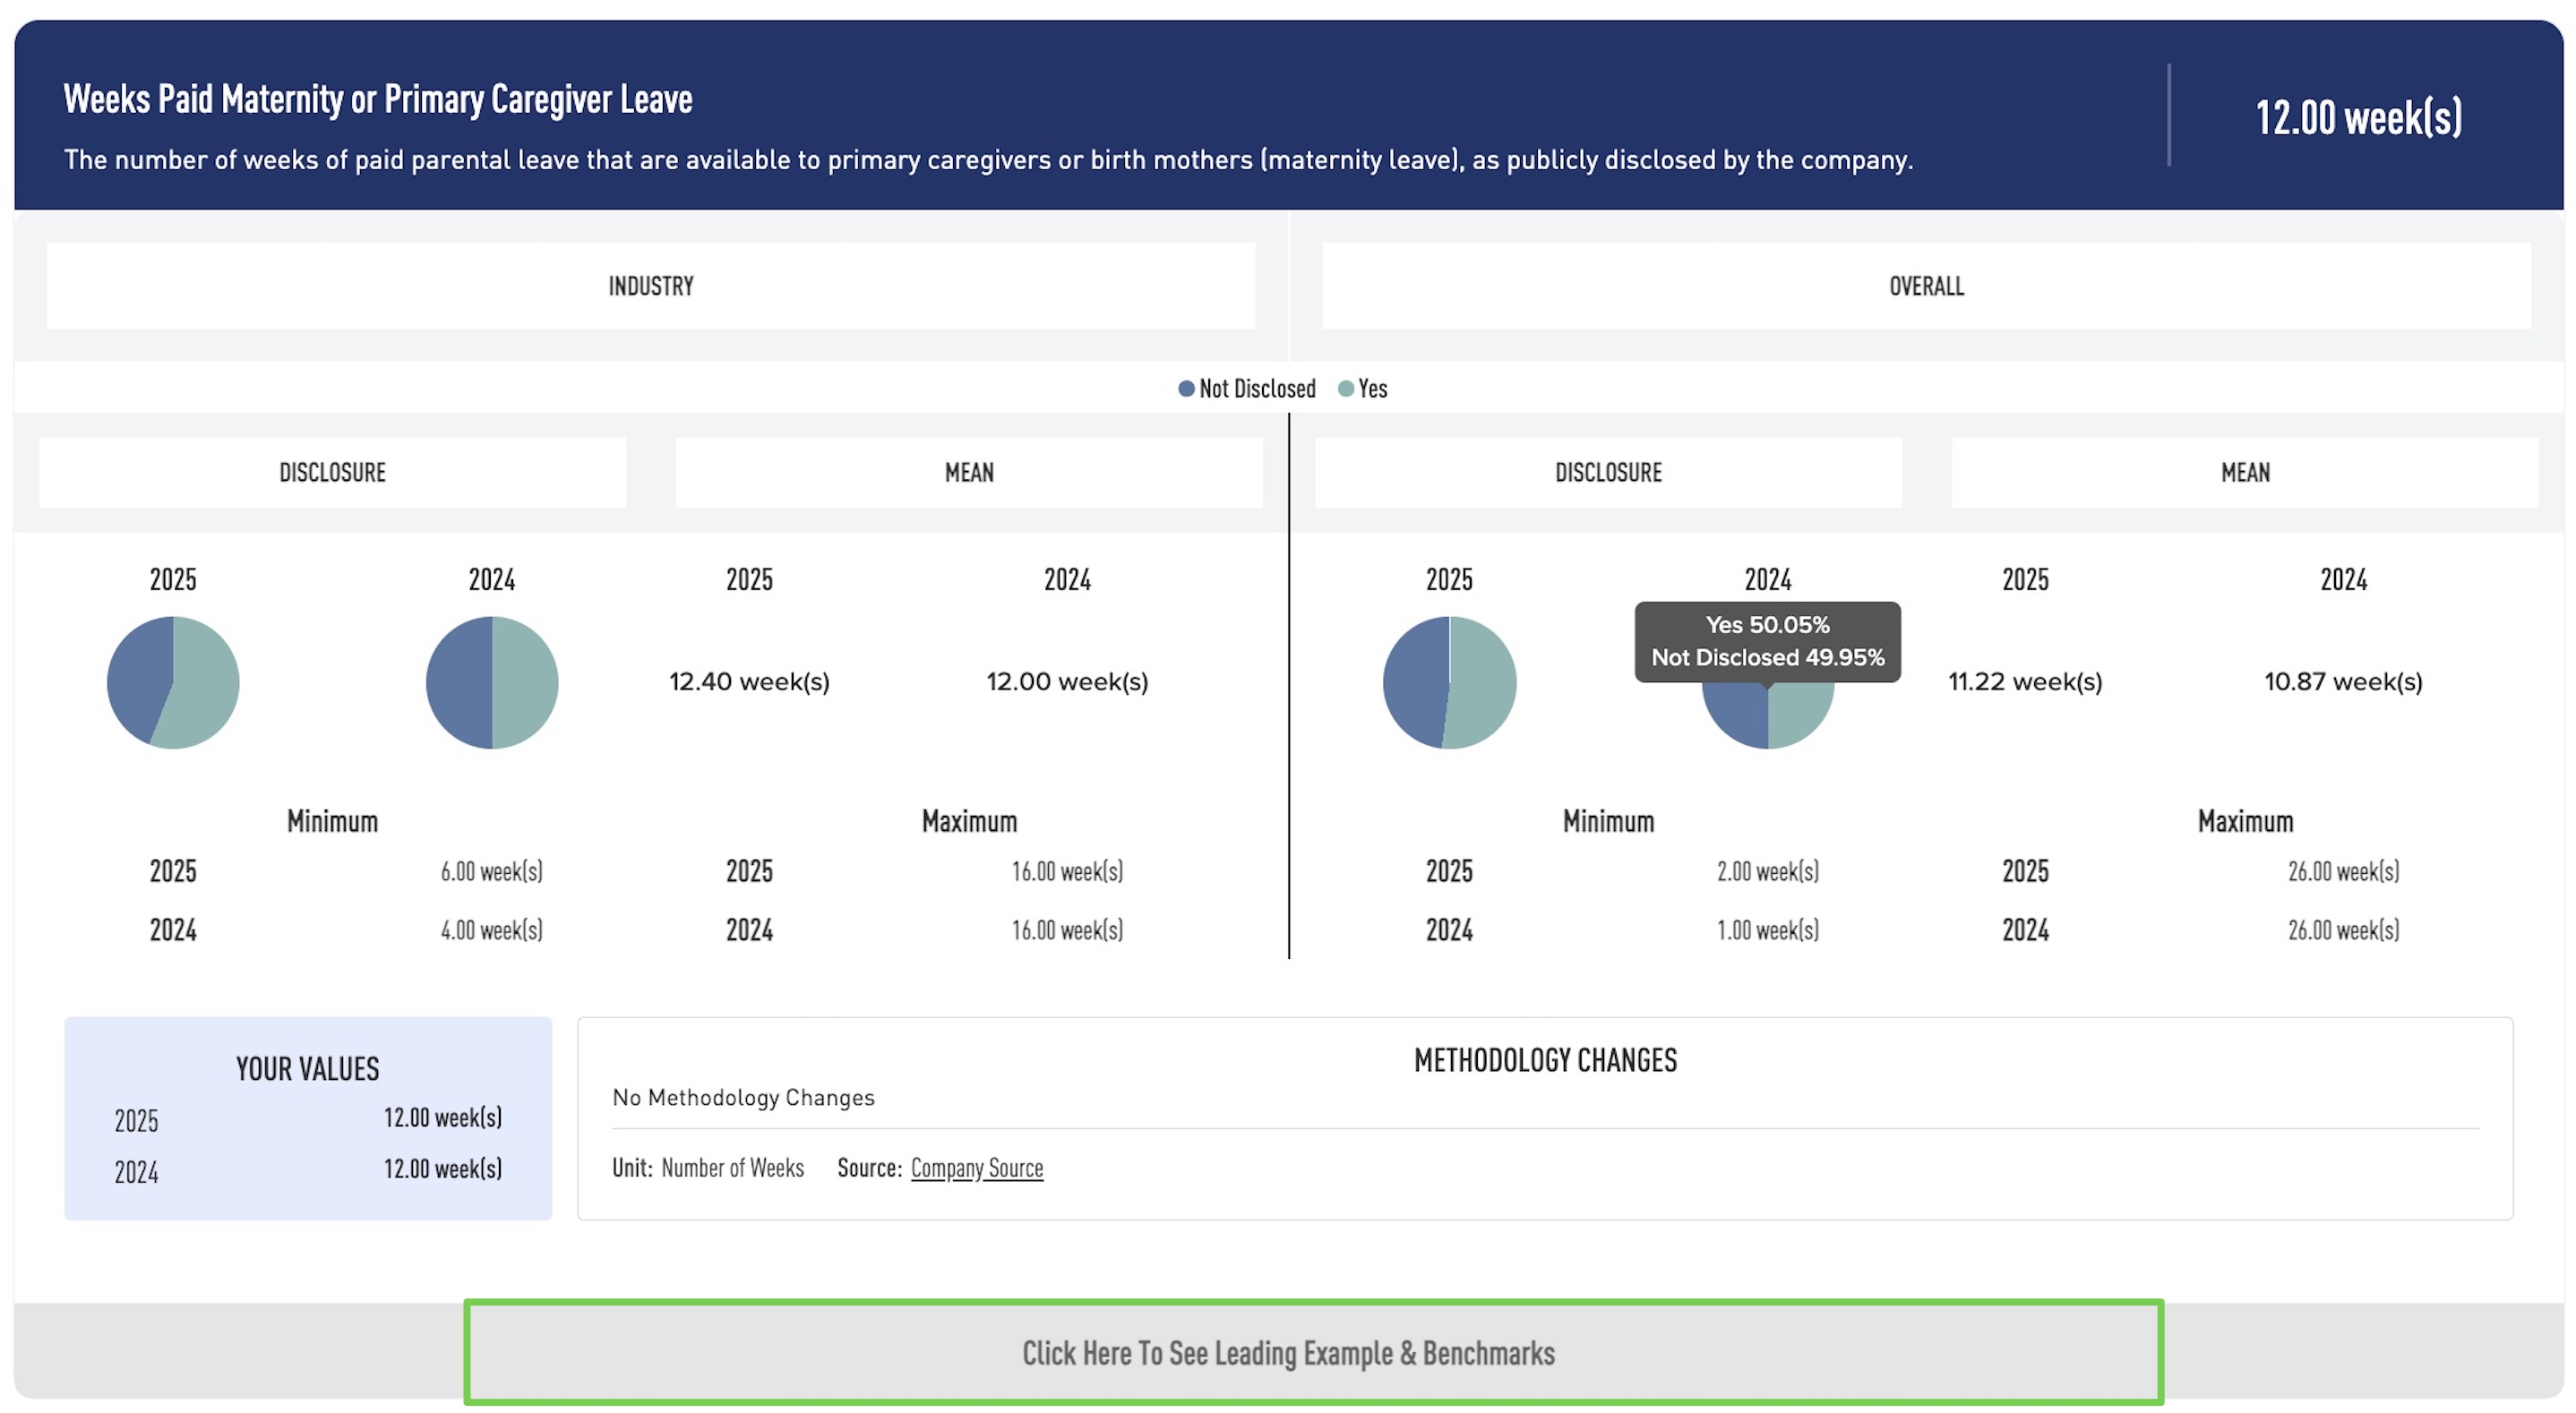
For JUST Intelligence subscribers, click into “Leading Example and Benchmarks” to view a leading practice.

Understand Your Ranking
Explore your performance trends and make data-driven improvements.